During the normal course of business, any expenditure incurred of which benefit is received during the same accounting period is called revenue expenditure. These expenses help a business sustain its operations and may not result in an increase in revenue.
Examples of such expenses are wages, rent, power, bad debts, depreciation, telephone, printing, cost of goods (to be sold), freight, maintenance of fixed assets, etc.
Unlike capital expenditure, these expenses are relatively small & recurring in nature. Sometimes referred to as revex these are used for meeting daily requirements of a business, therefore, they are short-term i.e. the benefit received is consumed by the business within the same accounting year.
It is shown on the debit side of the trading account & Income statement, the accounting treatment for both revex and capex is done differently.
All expenses are shown on the debit side of the below Trading and Profit & Loss account are revenue in nature.
The amount transferred to trading and P&L account should only be to an extent to which goods or services have been consumed. For example, cost of goods (to be sold) is a revenue expenditure, however, only the cost of goods actually sold in the current accounting period should be transferred to the trading account.
Short Quiz for Self-Evaluation
Loading
Your quiz has been submitted
Want to re-attempt? - Simply “refresh” this page.
Please check out more content on our site :)
Subscribed? - Check your mailbox
Thank You!
Server Side Error
We faced problems while connecting to the server or receiving data from the server. Please wait for a few seconds and try again.
If the problem persists, then check your internet connectivity. If all other sites open fine, then please contact the administrator of this website with the following information.
A purchase order (PO) is an official document generated by a buyer of goods/services as an offer for the seller. It becomes a “legal document of contract” once the seller accepts the purchase order. There are mainly 4 different types of purchase orders;
Standard PO
Contract PO
Blanket PO
Planned PO
StandardPurchase Order
It is the most basic and widely used among different types of purchase orders, it is created when a buyer is sure about the order details such as the item, price, delivery schedule, payment terms etc.
Example – Unreal corp. decides to buy 50,000 x 9W led bulbs from GE for a unit price of 10 each to be delivered within 60 days of the order date. In such case, Unreal corp. will raise a standard PO and send it to GE for acceptance.
Contract Purchase Order
It is created for a set period of time (often for a year) the item, pricing, quantity etc. can’t be anticipated precisely. In this case, a contract purchase order can be raised by the buyer, which upon acceptance becomes a legal contract.
During the contract period, the buyer can raise a standard PO with specifications of requirements and request for goods.
Example – Unreal Corp. analyzes and concludes that it often requires led bulbs of different wattage around different times of the year, however, the requirement is irregular and can’t be anticipated. In this case Unreal corp. can raise a contract purchase order.
Blanket Purchase Order
It is used in cases where the item is known, but the quantity and required delivery schedules are unknown. There can be numerous delivery dates against a blanket PO, they are often used in case of large quantities with exceptional discounts.
Example – Unreal corp. decides to buy 5,00,000 x 9W led bulbs each year but they are not sure about the delivery schedule & quantity of each release. In such a situation Unreal corp. will raise a blanket purchase order.
Planned Purchase Order
It is used for a planned purchase anticipated for long-term where the delivery schedule is not known in advance. The dates of delivery can only be anticipated therefore only tentative dates are provided to the seller. Item, pricing and quantity are however known in advance.
Example – Unreal Corp. has evaluated that it will have a long-term need for the next 5 years to buy 25,000 x 11W led bulbs each year. Instead of raising a standard PO each time Unreal Corp. can create a planned purchase order.
The reference table is shown below with different types of purchase orders and their respective scenarios
Short Quiz for Self-Evaluation
Loading
Your quiz has been submitted
Want to re-attempt? - “Refresh” this page.
Check out more content on our site :)
Subscribed? - Check your mailbox
Thank You!
Server Side Error
We faced problems while connecting to the server or receiving data from the server. Please wait for a few seconds and try again.
If the problem persists, then check your internet connectivity. If all other sites open fine, then please contact the administrator of this website with the following information.
Three-way matching is a procedure used in accounts payable to authenticate and verify the disbursal of payment to a creditor. This type of match involves matching Purchase Order (PO), Goods Receipt Note (GRN) & Invoice. Various departments work together to check things like price billed, quantity billed, quality & quantity of goods received etc.
Three-way matching is an important & common technique for firms since it mitigates credit risk by avoiding fraud invoices, underpaying, overpaying etc.
Purchase Order (PO) – After a supplier has been finalizedan official document is issued by a company to a supplier to buy specific goods or services. It usually contains the date, quantity, pricing, shipping terms, T&C etc.
Goods Receipt Note (GRN) – It is a document which is usually signed by the buyer at the time of delivery thus acting as evidence that the quantity delivered is exactly as desired by the buyer in its purchase order.
Invoice – Also known as a bill, it is a statement of all items purchased by a buyer in an order with price & quantity along with the total sum due on a particular date.
To avoid payment delays for a minor difference buyers would usually have a small currency amount set as a tolerance limit so any mismatch within the prescribed threshold is ignored and the invoice is paid after successful three-way matching.
Short Quiz for Self-Evaluation
Loading
Your quiz has been submitted
Want to re-attempt? - “Refresh” this page.
Check out more content on our site :)
Subscribed? - Check your mailbox
Thank You!
Server Side Error
We faced problems while connecting to the server or receiving data from the server. Please wait for a few seconds and try again.
If the problem persists, then check your internet connectivity. If all other sites open fine, then please contact the administrator of this website with the following information.
As the name suggests they are the final accounts which are prepared at the last stage of an accounting cycle. Final accounts show both the financial position of a business along with the profitability, they are used by external and internal parties for various purposes.
Trading account, Profit and Loss account and Balance Sheet together are called final accounts.
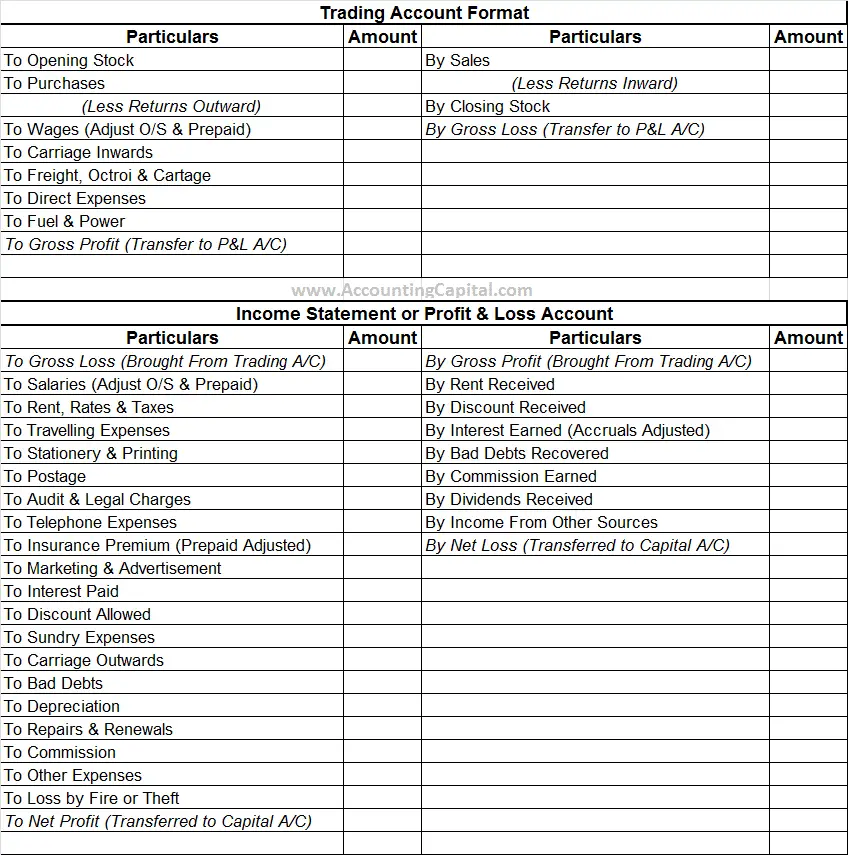
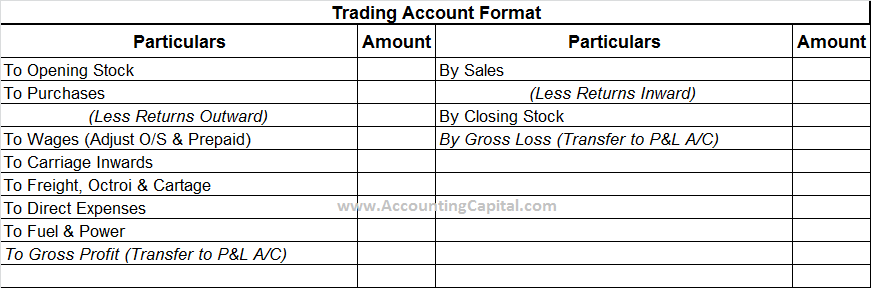
Trading Account
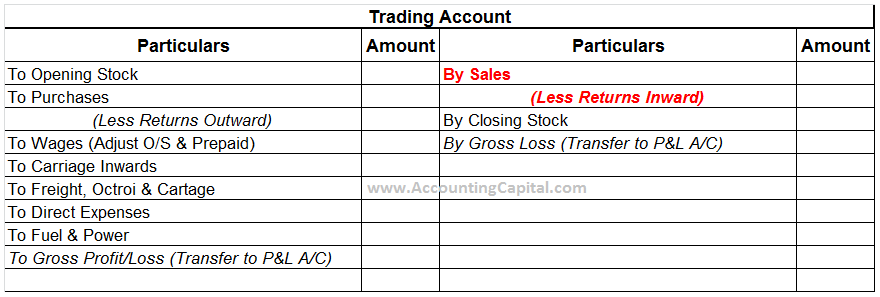
This account is the first account prepared as a final account, it is prepared to ascertain gross profit or gross loss incurred during an accounting period. On the debit side i.e. the LHS of the trading account items such as opening stock, purchases, and all direct expenses are shown.
Gross Profit – If the total of credit side is greater than debit side i.e. RHS > LHS the excess is called Gross Profit. It is transferred to the credit side of Profit and Loss account.
Gross Loss – If the total of the debit side is greater than the credit side i.e. LHS > RHS the excess is called Gross Loss. It is transferred to the debit side of Profit and Loss account.
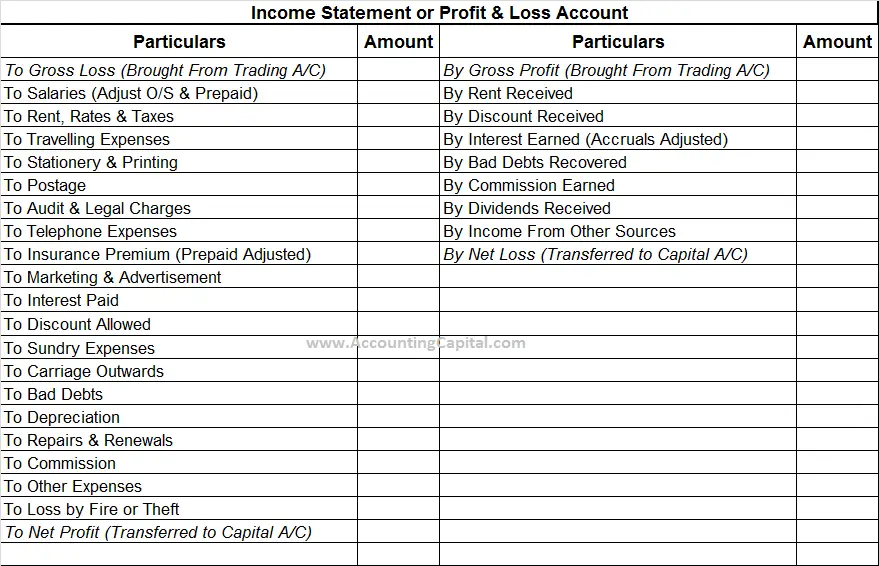
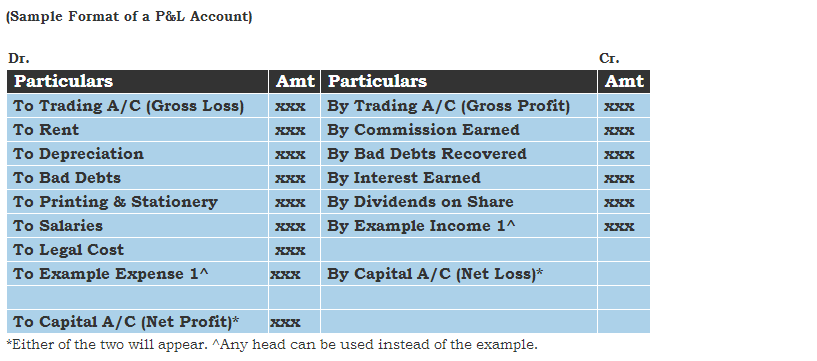
After preparation of trading account a profit and loss account also known as an income statement is prepared to ascertain the Net Profit or Net Loss incurred by a business. It begins with Gross Profit or Gross Loss being transferred from the trading account.
On the debit side of a Profit and Loss account, all indirect expenses such as salary, rent, office and admin, marketing, stationery etc. and loss incurred by the sale of assets or fire/theft etc. are mentioned.
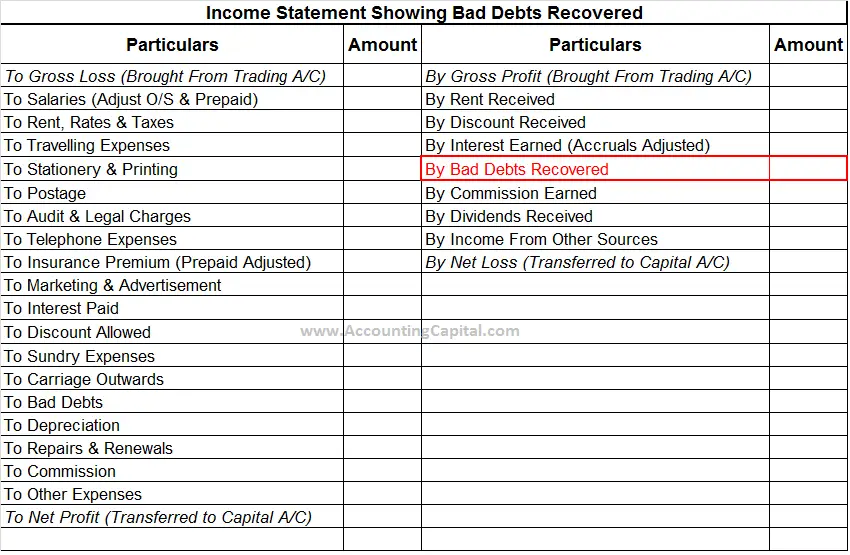
On the credit side of a Profit and Loss account, all indirect incomes such as interest earned, dividends received on shares, bad debts recovered, profit on the sale of assets etc. are mentioned.
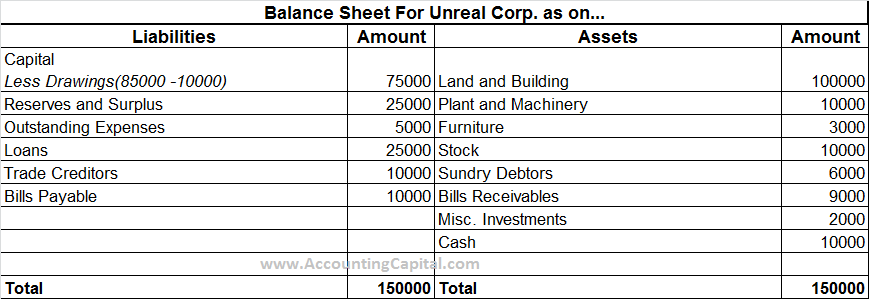
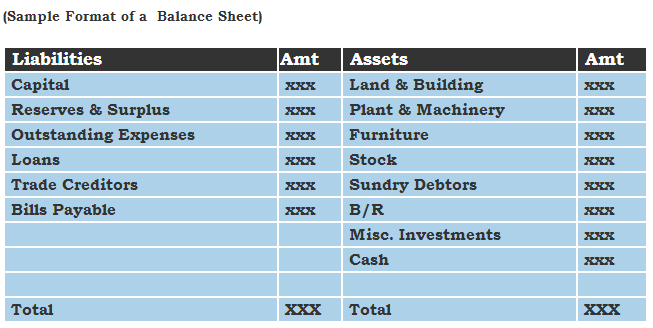
Both trading account and income statement help to determine the profitability of a business whereas a balance sheet is constructed to find out the financial position of the business as on a particular date. The balance sheet consists of capital, assets, and liabilities of a business.
It is a statement and not an account, it has no debit or credit side there “To” & “By” are not used inside a balance sheet. On the LHS of a balance sheet are all liabilities including capital and RHS will be all assets, for a balance sheet liabilities will always be equal to assets.
Below is a sample format of profit and loss account or income statement
Short Quiz for Self-Evaluation
Loading
Your quiz has been submitted
Want to re-attempt? - “Refresh” this page.
Check out more content on our site :)
Subscribed? - Check your mailbox
Thank You!
Server Side Error
We faced problems while connecting to the server or receiving data from the server. Please wait for a few seconds and try again.
If the problem persists, then check your internet connectivity. If all other sites open fine, then please contact the administrator of this website with the following information.
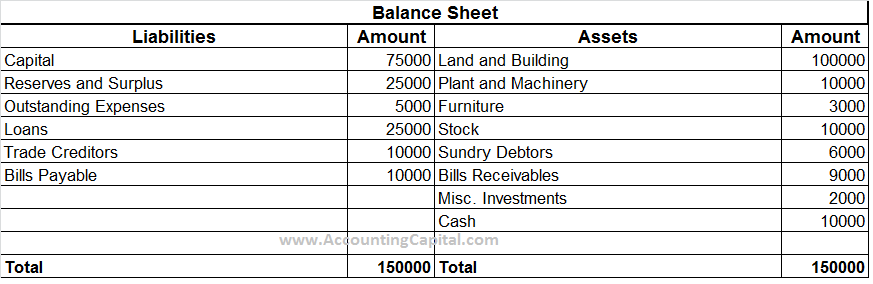
It is the total amount receivable to a business for sale of goods or services provided as a part of their business operations. Trade receivables consist of Debtors and Bills Receivables.Trade receivables arise due to credit sales.
They are treated as an asset to the company and can be found on the balance sheet.
Trade Receivables = Debtors + Bills Receivables
Example – Trade Receivables
Calculate trade receivables from the below balance sheet
Debtors are people or entities to whom goods have been sold or services have been provided on credit and payment is yet to be received for that. In addition, debtors are treated as current assets in a business.
Bills Receivable (B/R) is a bill of exchange accepted by a debtor or is received in way of an endorsement from them. The amount which is due to be received on a specific date is mentioned in the bill.
It is the total amount payable by a business for goods purchased or services availed as a part of their business operations. Trade payables comprise of Creditors and Bills Payables. Trade payables arise due to credit purchases.
They are treated as a liability for the company and can be found on the balance sheet.
Trade Payables = Creditors + Bills Payables
Example – Trade Payables
Calculate trade payables from the below balance sheet
Creditors are people or entities from whom goods have been purchased or services have been availed on credit and payment is yet to be made against that. In addition, creditors are treated as current liabilities in a business.
Bills Payable (B/P) is a bill of exchange accepted by a business the amount for which will be payable on the specific date mentioned in the bill.
Short Quiz for Self-Evaluation
Loading
Your quiz has been submitted
Want to re-attempt? - “Refresh” this page.
Check out more content on our site :)
Subscribed? - Check your mailbox
Thank You!
Server Side Error
We faced problems while connecting to the server or receiving data from the server. Please wait for a few seconds and try again.
If the problem persists, then check your internet connectivity. If all other sites open fine, then please contact the administrator of this website with the following information.
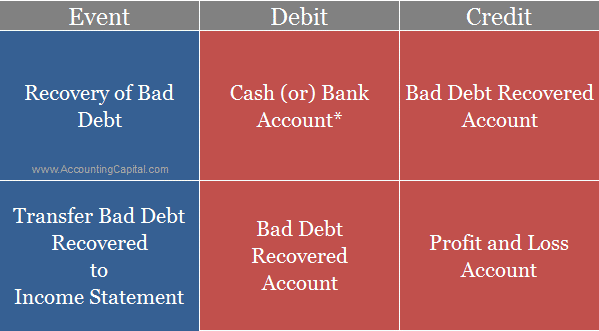
At times a debtor whose account had earlier been written off by a creditor as a bad debt may decide to make a payment. This is called “recovery of bad debts”. While posting the journal entry for bad debts recovered it is important to note that it is treated as a gain for the business & that the debtor should not be credited as in the case of sales.
While journalizing for bad debts debtor’s personal account is credited and the bad debts account is debited because bad debts written off are treated as a loss to the business and now when they are recovered it is seen as a fresh gain.
Journal entry for recovery of bad debts is as follows;
Cash A/c
Debit
Real A/C
Dr. What comes in
To Bad Debts Recovered A/C
Credit
Nominal A/C
Cr. income & gains
Debit (Cash A/c) assuming the recovery was done in cash
Rules applied as per modern or US style of accounting
Cash or Bank A/C
Debit the increase in assets
Bad Debts Recovered A/C
Credit the increase in income
The closing journal entry for bad debts recovered would be as follows;
Bad Debts Recovered A/C
Debit
To Profit and Loss A/C
Credit
(Transferring bad debts recovered to the income statement)
Unreal corp was declared insolvent last year and an amount of 70,000 was shown as bad debts in the books of ABC corp, this year Unreal corp decided to pay cash 70,000 against the same debt.
In the books of ABC Corp.
Cash A/C
70,000
To Bad Debts Recovered A/C
70,000
(Cash received from Unreal corp previously written off as bad debt)
Bad Debts Recovered A/C
70,000
To Profit & Loss A/C
70,000
(Transferring bad debts recovered to the income statement)
Short Quiz for Self-Evaluation
Loading
Your quiz has been submitted
Want to re-attempt? - Simply “refresh” this page.
Please check out more content on our site :)
Subscribed? - Check your mailbox
Thank You!
Server Side Error
We faced problems while connecting to the server or receiving data from the server. Please wait for a few seconds and try again.
If the problem persists, then check your internet connectivity. If all other sites open fine, then please contact the administrator of this website with the following information.
Revenue and Profit are terms often used interchangeably however they are different and are calculated in a different way before being shown in the books of accounts. In a nutshell, the difference between revenue and profit is that Revenue can be termed as money a business makes by selling its main goods/services whereas profit is what is left after paying all the bills.
Revenue
Profit
Money earned by selling main goods and/or services to customers
Net Earnings of a business left after deduction of all expenses
Revenue = Total Sales – Total Returns
Profit = Total Revenue – Total Expenses
Also known as Sales, Sales Revenue, Turnover, Gross Income
Also known as Bottom Line, Net Profit, Net Earnings
It is shown in Trading Account
It is shown in Income Statement
Revenue
Also known as Sales, Sales Revenue, Turnover, Gross Income, Top Line. It is the amount of money a business earns by selling its main goods & services to its customers. All proceeds gathered only from the company’s core business operations are eligible to be part of a company’s revenue.
For example, Ford Motor Company’s core business is selling cars so whatever amount it earns over a fixed period of time from the sale of cars will be its revenue for that period. Now, if Ford Motor Company has an investment of 100 Million and earns 1 Million every year from that it will not be counted towards its direct revenue rather it is termed as “income from other sources”.
Below is a trading account showing (red highlighted) Revenue of a business. (Sales – Returns)
Profit
Also known as Bottom Line, Net Profit or Net Earnings. Profit is what is left after the deduction of all expenses from revenue. Profits can be calculated at various levels e.g. Gross Profit, Net Profit etc. From a broader perspective Profit = Revenue – Expenses.
Gross Profit is the difference between total revenue earned from selling products/services and the total cost of goods/services sold. Gross Profit = Total Revenue – COGS (Cost of Goods Sold)
Below is an income statement showing (in red highlighted) profit earned by a business during a particular period
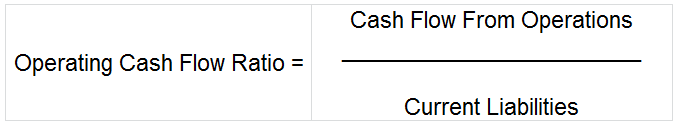
Operating cash flow ratio also known as cash flow from operations ratio is calculated by dividing cash flow from operations by current liabilities. All cash generated from firm’s core business operations is termed as operating cash.
It is different from cash generated through investing and financing in a way that it doesn’t take into account any extra cash generated apart from a business’ core operations. This ratio determines a firm’s liquidity by evaluating its operating cash with respect to its current liabilities.
Inside a cash flow statement, non-cash charges are adjusted from a business’ net income which then increases or decreases the working capital. This adjustment results in the final operating cash flow of a company.
Formula to Calculate Operating Cash Flow Ratio
Cash Flow From Operations: Revenue from operations + Non-cash based expenses – Non-cash based revenue
Current Liabilities: It includes Creditors, B/P, Accrued Expenses, Provisions, Short-Term Loans etc.
Example of Operating Cash Flow Ratio
From the below details of Unreal corporation calculate their operating cash flow ratio for the quarter ending 30th June 2018
Net Cash Flow From Operations
Current Liabilities
Q2 2018
200,000
150,000
Operating Cash Flow Ratio Q2 2018
1.33
Cash flow from operations ratio of 1.33 shows that for every unit of current liability the company had 1.33 units of cash flow from operations during the second quarter of 2018.
High & Low Operating Cash Flow Ratio
High cash flow from operations ratio indicates better liquidity position of the firm. There is no standard guideline for operating cash flow ratio, it is always good to cover 100% of firm’s current liabilities with cash generated from operations. So a ratio of 1 & above is within the desirable range.
Low cash flow from operations ratio i.e. below 1 indicates that firm’s current liabilities are not covered by the cash generated from its operations. This is not a desirable state for a business and shows a stressed liquidity position.
Short Quiz for Self-Evaluation
Loading
Your quiz has been submitted
Want to re-attempt? - “Refresh” this page.
Check out more content on our site :)
Subscribed? - Check your mailbox
Thank You!
Server Side Error
We faced problems while connecting to the server or receiving data from the server. Please wait for a few seconds and try again.
If the problem persists, then check your internet connectivity. If all other sites open fine, then please contact the administrator of this website with the following information.
Sukanya Samriddhi Yojana (SSY) is a scheme exclusively for girl children, started by the Prime Minister of India Mr. Narendra Modi on 22nd January 2015 in Panipat, Haryana. The scheme mainly assists parents of a girl child to create a reserve for their education & marriage-related expenses.
SSY scheme proposes a deposit plan for a girl child which offers a high-interest rate on deposits. Till October 2015 under Sukanya Samriddhi Yojana there were more than 7 Million active accounts with a total fund of about US $420 Million.
Benefits of Sukanya Samriddhi Yojana
SSY account matures after 21 years from its inception date & the amount is disbursed to the account holder. An exception to this can be availed if the girl child is above 18 years old and intends to marry.
From the year 2016-17, the rate of interest provided in this scheme is 8.6% (P.A) compounded annually. Click Here for latest Interest Rates of SSY.
Now 100% withdrawal is allowed from the scheme when the account holder has attained the age of 18 years.
Investment in Sukanya Samriddhi Yojana scheme is exempted from Income Tax under section 80(c). Principal, interest and outflow all three are exempted from tax.
An SSY account can be transferred to another bank/post office on request.
Eligibility & Other Criteria
The account can be opened by a guardian in the name of a girl child from her birth until she becomes 10 years old.
Only one account is allowed per girl child.
The maximum number of accounts allowed are 2 by a legal guardian for two different girl child, only exceptions provided are in case if the first or the second birth are twins or triplets.
A minimum of *Rs 250 needs to be deposited in the Sukanya Samriddhi Account in a financial year else it is discontinued and can only be revived with a penalty of Rs 50 per year with the minimum amount required for a deposit for that year.
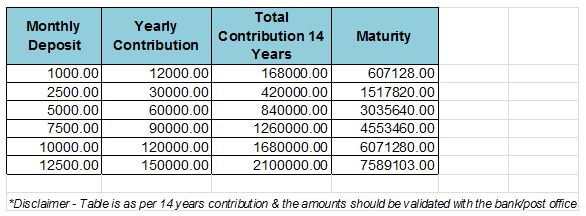
Investment in an SSY account can be increased in multiples of thousands with a cap of Rs 1,50,000 in a financial year, a regular investment is to be made for 15 years (earlier it was 14 yrs).
Sukanya Samriddhi Yojna account can be opened for an adopted girl child as well.
Loan facility is not provided against this scheme.
How to Open an SSY Account & Documents Required
Sukanya Samriddhi Yojana account can be opened at any Indian Post office or at a branch of an authorized bank for e.g. SBI, ICICI Bank etc.
Atal Pension Yojna – Securing the Unorganized Sector
On 9th of May 2015, Prime Minister Narendra Modi formally launched the Atal Pension Yojna (APY) which is a government supported pension program in India and is meant for workforce in the unorganized section. The scheme is managed by PFRDA (Pension Fund Regulatory and Development Authority) with the help of National Payment Scheme’s design.
Under this scheme, for every contribution made towards the pension fund, 50% of the total contribution or Rs 1000/- whichever amount is lower, will be co-funded for up to 5 years by the central government.
Government’s co-contribution is only available for those who are not covered by any statutory social security schemes and are not Income Tax payers. Pension starts once the person becomes 60 years old hence the requirement is for a person to pay for at least 20 years under the scheme.
Eligibility
APY is available to all citizens of India between 18 – 40 years of age
KYC compliant Bank account is a mandate
How to Enroll for Atal Pension Yojna
Walk-in to your nearest bank (All PSUs would offer this scheme)
You may either download the application form beforehand from a bank’s website or ask for one at the branch
Fill the form appropriately, ensure to mention a working mobile number & submit the form at the branch
Lastly you will be asked to submit a photocopy of your aadhar card along with form
All existing Swavalamban scheme subscribers, if eligible, may automatically be migrated to Atal Pension Yojna with an option to opt out.
or
Alternatively, you can download the form directly from govt. website.
Payout and Contribution
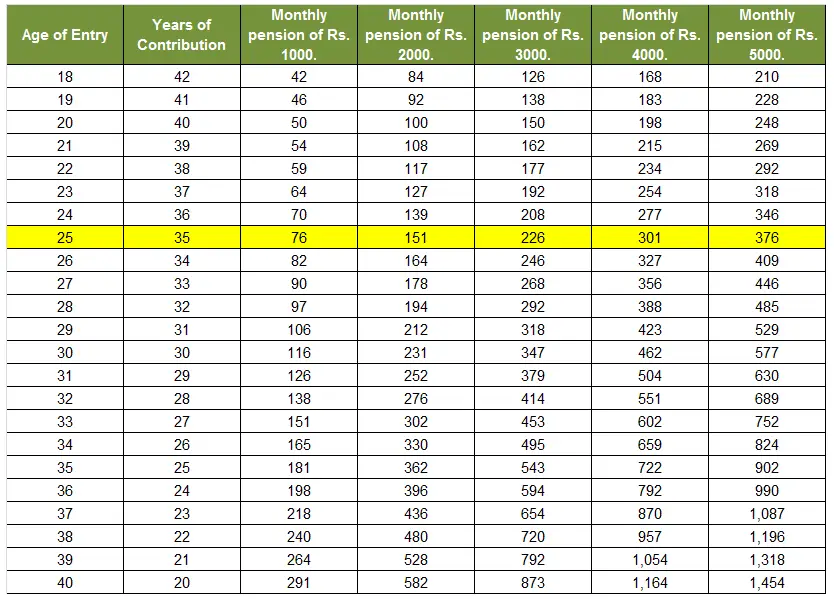
Under Atal Pension Yojna (APY), there is a guaranteed minimum monthly pension for subscribers, it varies between Rs 1000 and Rs 5000 per month depending upon the contribution.
Below is a chart showing different contributions at different life stages, such as if you’re 25 years old and you wish to earn a pension of Rs 5000 at the age of 60 your monthly contribution will be Rs 376 per month.
The contributions are debited automatically from the subscriber’s bank account. Under APY, the monthly pension is available to the subscriber, and after their death to the spouse. In case the spouse also dies the pension corpus as accumulated at age 60 (of the subscriber) would be provided to the nominee.
Defaults and Discontinuation of Payments
Banks are authorized to collect a penalty amount for delayed payments, such amount will vary from Re 1 per month to Rs 10 per month depending on the contribution amount.
Re. 1 per month for contributions up to Rs. 100 per month
Re. 2 per month for contributions up to Rs. 101 – 500 per month
Re 5 per month for contribution between Rs 501 – 1000 per month
Rs 10 per month for contributions beyond Rs 1001 per month
If you discontinue making payments this is what happens to your account:
After 6 Months
Account is Frozen
After 12 Months
Account is Deactivated
After 24 Months
Account is Closed
All amendments & further details can be found on the official website for this scheme www.jansuraksha.gov.in
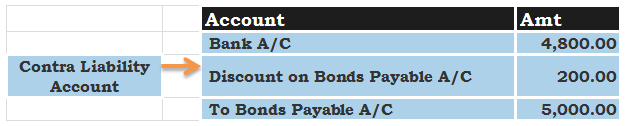
A liability account would usually contain credit balance however at times to offset a liability a separate account is used which contains debit balance and is paired along with it, this account is called a contra liability account. Seldom used in practice a contra liability account is used for book value adjustments related to an asset or a liability.
When an entry is recorded in this account the usual rules of entry are reversed adding a debit entry to the contra account. If there is no offset required against a related liability a contra account might have zero balance. Journal entry item related to contra liability account can possibly be identified with the often used word “discount”.
Examples of Contra Liability Account
Bond Discount Account
Journal entry for a bond worth 5000 being sold at 4800 (200 discount) would be captured as:
In the above journal entry “Discount on bonds payable account” offsets the “Bonds payable account”, this can be identified since both of them are oppositely treated i.e. debited and credited respectively.
To find out the current actual value of bonds payable the accountant would have to reduce the debit balance inside the contra liability account from credit balance of the particular liability account.
Value of Bonds = Credit Balance of Bonds Payable – Debit Balance of Discount on Bonds Payable
Gain on Reduction Account
If a borrower is having problems in paying back his loan amount, the lender would want to get whatever amount they can from the borrower for which they might mutually consider a negotiated reduced amount.
Though it is seldom used, however, in case if the amount payable is adjusted through negotiations gain on reduction account is used to offset the remaining amount in loan payable account which ultimately reduces the total obligations of a company.
Most often in such situations the amount of loan payable is reduced directly from loan payable account & a profit is shown on the Income statement of the business.
An income statement is also known as a profit and loss account, statement of income or statement of operations. Besides balance sheet and statement of cash flows, income statement is also among important financial statements which measures the financial performance of a company over a certain period.
After the preparation of a trading account, a profit & loss account is prepared to determine the net profit earned or net loss incurred due to the operations of a business. It is an important final account of a business which shows the summarized view of revenues and expenses for a particular accounting period.
An income statement shows the profitability of a company for a specified time interval as mentioned in the heading. It may be a fiscal quarter, fiscal year or a custom range as per requirement.
Income statement displays expenses, losses, revenue and gains. Cash transactions are never included in an income statement whether they are cash receipts or cash disbursements. It helps to determine a company’s current position whether it is in profit or loss. It is important for a company to disclose their income statement especially to those who are associated with the company e.g. investors, lenders, company management, labor unions, government agencies, potential investors etc. A profit-making company therefore not only increases its credibility in the market but also attracts more investors.
Profit and Loss Account or Income Statement will have the following constituents:
Revenues and Gains
Operating revenues derived from primary activities of a business, it may differ according to the nature of business. For a manufacturer his primary activities would be production and sale of his products but for a wholesaler or retailer his primary activities will be buying and then selling of his merchandise.
Revenues or income from secondary activities – Other than its main activities a business may earn from other activities as well. For example a retailer could get his extra finances by renting a place, interest revenue, etc.
Gains – For example: gains from lawsuits or gains from the sale of long-term assets used in business, etc.
These are shown on the right hand side of a profit and loss statement.
Expenses and Losses
Operating expenditure incurred related to all primary activities of a business.
Other expenses incurred related to secondary activities.
Losses. For example: loss from natural disasters, costs of writing down good will or intangible assets etc.
These are shown on the left hand side of a profit and loss statement.
The difference of two sides of this account is either net profit or net loss, which is then transferred to the capital account.
Short Quiz for Self-Evaluation
Loading
Your quiz has been submitted
Want to re-attempt? - “Refresh” this page.
Check out more content on our site :)
Subscribed? - Check your mailbox
Thank You!
Server Side Error
We faced problems while connecting to the server or receiving data from the server. Please wait for a few seconds and try again.
If the problem persists, then check your internet connectivity. If all other sites open fine, then please contact the administrator of this website with the following information.
Balance sheet is a financial statement which shows the net worth of a company at the end of a financial period. A Balance sheet portrays the financial position of a company, disclosing what it owes and owns. It is an important document that needs to be prepared and submitted regularly like when submitting taxes, applying for grants or loans, while looking for investments etc. A company’s balance sheet comprises of three parts: assets, liabilities and capital or equity.
Following is the formula used for calculation: Assets = Liabilities + Capital
(Also known as the accounting equation or balance sheet equation)
Assets
Assets are tangible or intangible resources owned by the company that has an economic value which can be expressed and measured. From a business point of view assets include cash, inventory, investment, equipment, building, etc.
Some items that may be seen in the Assets section of a company’s Balance Sheet are:
Cash
Accounts receivable
Patents
Equipment
Inventory
Reimbursable expenses
Liabilities
Liability is a legal obligation to be paid by the company. Liability could be incurred due to business transactions happening in the company. In a business, liabilities could be – pending taxes, credit card bills, loans etc.
Some items that may appear in the Liabilities section of a company’s Balance Sheet are:
Taxes
Accounts payable
Credit cards payable
Long term loans
Current loans
Capital or Shareholder’s Equity
Capital is the owner’s share on the company’s assets. This share is nothing but the assets that are left after the deduction of the liabilities. In a business, equity is what you infuse in the business.
Some items that could appear in the Capital section of a company’s Balance Sheet are:
Owners Capital – An investment from the owner in the company and the net income earned that has been earned by the company subtracted by any withdrawals if made by the owner. An owner’s personal bank account and business bank account are two different entities.
Retained Earnings – Part of the net income which is retained by the corporation instead of distributing it among its owners as dividends.
A balance sheet is perfect only when the Total Assets are exactly equal to the Sum of Liabilities and the Owner’s Equity. If there is a difference in the amounts, it needs to be rechecked for missing items.
Short Quiz for Self-Evaluation
Loading
Your quiz has been submitted
Want to re-attempt? - “Refresh” this page.
Check out more content on our site :)
Subscribed? - Check your mailbox
Thank You!
Server Side Error
We faced problems while connecting to the server or receiving data from the server. Please wait for a few seconds and try again.
If the problem persists, then check your internet connectivity. If all other sites open fine, then please contact the administrator of this website with the following information.
As per the new Accounting Standards in India (Ind AS), for companies having a net worth of Rs 500 crore or more it is mandatory to adopt the Indian Accounting Standards from April 1, 2016.
In the 2009 G-20 summit, India had committed to take required steps to “restore the momentum of growth in the developing world” with the convergence of Indian Accounting Standards (Ind AS) with International Financial Reporting Standards (IFRS). After which the Ministry of Corporate Affairs devised a road map to implement the convergence of Indian Accounting Standards with International Financial Reporting Standards from April 2011.
It was meant for all Indian companies; however the insurance, banking and non-banking finance companies were exempted. The step taken was unsuccessful because of a few glitches like unresolved taxes but the FY 15 Budget had once again proposed to adopt the Ind AS. The Honorable Minister for Finance also clarified that the dates of implementation of the particular regulators for banks and insurance companies will be notified separately. A separate notification for standardized tax computation in accord with the budget will also happen on a set date.
The Implementation
The execution of new accounting standards in India will happen in two phases:
Phase I applicable from April 1, 2016 onwards
It is obligatory for all companies either listed or unlisted, having a net worth of more than Rs 500 crore to apply Ind AS.
It is also applicable for all the holding joint ventures, associates or subsidiaries of such companies.
Phase II applicable from April 1, 2017 onwards
Any company whose debt or equity securities has been listed or is going to be listed within India or outside — having a net worth of less than Rs 500 crore.
Unlisted companies whose net worth is more than Rs 250 Crore but less than Rs 500 crore.
Holding, subsidiaries, joint ventures or associates of such companies also need to apply Ind AS.
The net worth of a company has to be calculated in agreement to the company’s stand-alone financial statement as on March 31, 2014 or the audited financial statements which are first for accounting period after March 31,2014.
The Impact
There could be either positive or negative impact on the net income and net worth of the companies because of the areas like taxes, financial instruments and revenue recognition. Furthermore there could also be an impact on arrangements with lenders, vendors, customers, internal control systems and changes to IT system. More than 350 companies from BSE 500 are predicted to migrate from FY17. Besides delivering more disclosures application of Ind AS will also bring material changes to return ratios and operating metrics of companies.
Unified Payment Interface (UPI) – Instant and Cashless
Developed by National Payments Corporation of India (NPCI) the Reserve Bank of India launched Unified Payment Interface (UPI). Money transfers will not only be easy to send but more instantaneous and secured.
Unified payment interface is a common system across retail systems designed to enable all account holders to both send and receive cash with the help of smartphones using Aadhar, Mobile Number etc.
The Unified Payment Interface could change the money micro-payment process throughout the country. Sending money will become as easy as sending an SMS or making a phone call. As per a report, around 65 percent in value terms and 95 percent of consumer transactions in volume terms happen in cash. For an advanced economy, transaction in volume is higher than 40 to 50 percent and 10 to 20 percent higher in terms of value.
Reserve Bank of India along with the government has been working together on techniques to diminish cash in the economy. Since the mobile industry is thriving, the number of smartphones in the country is predicted to go up from 200 million to about 500 million. There is definitely going to be a boost in mobile money transfer.
Unlike online banking which takes some time to transfer cash, UPI completes a cash transaction instantly. Presently, only some banks offer the Immediate Payment Service (IMPS); the lone way available to customers using which they can send cash across banks instantly. IMPS transaction requires details like bank account number, IFSC code, and email id for proof of identity.
UPI has eliminated manifold identifications and will accept the mobile number or Aadhar card number to complete a transaction. Phase one will have 29 banks operating the platform. It will permit instant money transfers inter-operable across many banks.
Key Benefits of Unified Payment Interface
Every consumer with a bank account can avail the benefits of this service.
Consumers will not require details such as account number, IFSC code etc. to transfer money.
Application providers can gain from integrating multiple channels, innovative features & swift authentication services.
Unified payment interface will lighten the burden on banks and other payment portals which deal with a huge number of mobile transactions on daily basis.
Startup India Initiative to Boost Entrepreneurship
On the Independence Day, 2015 at Red Fort, Prime Minister Mr.Narendra Modi recited the slogan, “Startup India, Stand up India”. Startup India campaign aims at promoting bank financing for start-up companies to encourage entrepreneurship and eventually leading to more In-house jobs for people of India. On 16 January 2016, Vigyan Bhavan, New Delhi, this campaign kick started and plans were laid out officially to ease out the hurdles hindering the path of start-ups.
Start Up process simplified – A mobile app was rolled out by the government on April 1, particularly for start-ups. Setting up and registering for a start-up will be abridged by this app.
Launch of Atal innovation mission – The Mission has been declared to aid incubate start-ups. The funds will be utilized to grant seed funds and will also fuel the incubation facilities that are already running. It will also train the pre-incubation entrepreneurs.
Compliance regime based on self-certification – Initially the start-ups will self-certify their compliance with the labor and environment laws. There will be no inspection for the first three years.
Protection & rebate on patents – In order to protect the patents, government will set up a panel of legal facilitators who will help in filing the patents. For the first year all the patents filed will be given a rebate of 80 percent.
Funds to be invested – For the registration process to happen smoothly the government the startups have been granted a 90 day open window to close down their businesses if they do not work out. A Rs 10,000 crore with an infusion of Rs 2,500 crore every year has been planned for the growth and expansion of the start-ups.
Tax exemption – From the 1st April, 2016 all start-ups will be relieved of both capital gain and tax in profits for the first three years. The exemption will be only for the ones who have invested in the capital gains of government recognized funds.
New Research Parks & Incubators – The government has planned to set 13 startup centers and 18 technology business centers, besides there will be 31 innovation centers to be set up at national institutions, 7 research parks, 150 technology transfer offices, 50 bio-technology incubators and 20 bio-connect offices.
Promotion of New Ideas – In order to avail these facilities, your company turn over should not exceed Rs 25 Crore. The product of the start-up business should be new and of value to the customers. This will help in new innovations rather than copying an already existing product.
For students – A Grand Challenge Program will award Rs 10 lakhs to twenty innovations done by students, starting with 5 lakh schools to target 10 lakh children for innovation program.
Easy exit policy – Convenient bankruptcy rules to be put in place which will allow a company to exit within 90 days.
More details on Startup India Campaign can be found at their official website www.startupindia.gov.in
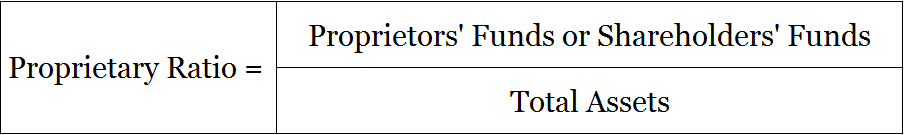
This ratio shows the proportion of total assets of a company which are financed by proprietors’ funds. The proprietary ratio is also known as the equity ratio. It helps to determine the financial strength of a company & is useful for creditors to assess the ratio of shareholders’ funds employed out of the total assets of the company.
The word “Proprietors” is a synonym for “owners of a business”, proprietors’ funds, in this case, would only be the funds which belong to the owners/shareholders of the business. Proprietors’ funds are also known as Owners’ funds, Shareholders’ funds, Net Worth, etc.
Formula to Calculate Proprietary Ratio
Proprietors’ funds or Shareholders’ funds = Share Capital + Reserves and Surplus
Total Assets = Includes total assets as per the balance sheet
From the balance sheet of Unreal Corporation calculate its proprietary ratio
Liabilities
Amt
Assets
Amt
Share Capital
10,00,000
Tangible Assets
10,00,000
Reserves & Surplus
2,00,000
Long-Term Investments
5,00,000
Short-Term Borrowings
40,000
Stock
70,000
Trade Payable
4,00,000
Trade Receivable
70,000
Total
16,40,000
Total
16,40,000
Shareholders’ Funds/Total Assets
S/H Funds = 10,00,000 + 2,00,000
Total Assets = 16,40,000
12,00,000/16,40,000
Proprietary ratio = 0.73
A proprietary ratio of 0.73 shows that the company has 0.73 units of shareholders’ funds for each unit of total assets or in other words, 73% of the total assets of the company are financed by proprietors’ funds.
High & Low Proprietary Ratio
High – This ratio indicates the relative proportions of capital contribution by shareholders in comparison to the total assets of a company. It is used as a screening device for financial analysis, a higher ratio, say more than 75% means sufficient comfort for creditors since it points towards lesser dependence on external sources.
Low – Whereas, a lower ratio, say less than 60% means discomfort for creditors since it shows more dependence on external sources, a lower ratio can be seen as a threat and may increase the unwillingness of creditors to extend credit to the company. A company should mix and balance its external and internal sources in a way that none of them is too high in comparison to the other.
Short Quiz for Self-Evaluation
Loading
Your quiz has been submitted
Want to re-attempt? - “Refresh” this page.
Check out more content on our site :)
Subscribed? - Check your mailbox
Thank You!
Server Side Error
We faced problems while connecting to the server or receiving data from the server. Please wait for a few seconds and try again.
If the problem persists, then check your internet connectivity. If all other sites open fine, then please contact the administrator of this website with the following information.
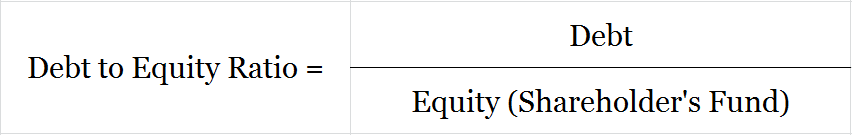
Debt to equity ratio shows the relationship between a company’s total debt with its owner’s capital. It reflects the comparative claims of creditors and shareholders against the total assets of the company. It is a measurement of how much the creditors have committed to the company versus what the shareholders have committed.
Normally, the debt component includes long-term borrowings & long-term provisions, the equity component consists of net worth and preference shares not redeemable in one year.
If the purpose of calculating debt to equity ratio is to examine the financial solvency of a firm in terms of its ability to avoid financial risk, preference capital should be added to equity capital, however, if the intention is to show the effect of the use of fixed interest/dividend sources of funds w.r.t earnings available to ordinary shareholders then preference capital should be added to the debt.
Formula to Calculate Debt to Equity Ratio
Total Debt: Includes both long-term debt & long-term provisions
Equity (S/H Fund): Share Capital + Reserves & Surplus
Example of Debt to Equity Ratio
From the balance sheet of Unreal corporation calculate its debt to equity ratio
Liabilities
Amt
Assets
Amt
Share Capital
2,00,000
Tangible Assets
80,000
Reserves & Surplus
40,000
Intangible Assets
1,40,000
Long-Term Borrowings
40,000
Current Assets
1,20,000
Long-Term Provisions
20,000
Current Liabilities
40,000
Total
3,40,000
Total
3,40,000
Total Debt = Long-Term Borrowings + Long-Term Provisions
Equity (S/H Funds) = Share Capital + Reserves & Surplus
A debt to equity ratio of 0.25 shows that the company has 0.25 units of long-term debt for each unit of owner’s capital.
High & Low Debt to Equity Ratio
This ratio indicates the relative proportions of capital contribution by creditors and shareholders. It is used as a screening device in financial analysis. A lower percentage shows that the company is less dependent on borrowed money from outside parties, or in other words, has less debt as compared to its total shareholder’s funds, this is a favourable situation for external parties since they enjoy a higher safety margin.
A higher percentage on the other hand shows that the company depends a lot on its debt (borrowed funds + money owed to others) as compared to its shareholder’s funds, this puts external parties at a higher risk. Generally, well-established companies can push their debt component to higher percentages without getting into financial trouble.
In general, felt by the lenders. One of the limitations of this ratio is that the computation is based on book value, as it is sometimes useful to calculate these ratios using market values.
Short Quiz for Self-Evaluation
Loading
Your quiz has been submitted
Want to re-attempt? - “Refresh” this page.
Check out more content on our site :)
Subscribed? - Check your mailbox
Thank You!
Server Side Error
We faced problems while connecting to the server or receiving data from the server. Please wait for a few seconds and try again.
If the problem persists, then check your internet connectivity. If all other sites open fine, then please contact the administrator of this website with the following information.
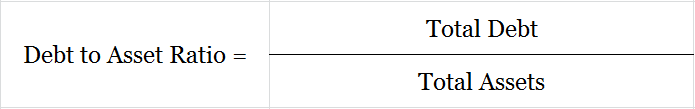
It is also called debt to total resources ratio or only debt ratio. The debt to asset ratio measures the percentage of total assets financed by creditors. It is computed by dividing the total debt of a company with its total assets. This ratio provides a quick look at the part of a company’s assets which is being financed with debt.
It shows the amount of debt obligation a company has for each unit of an asset that it owns, this enables the viewer to determine the financial risk of a business. This ratio measures the extent to which borrowed funds support the firm’s assets.
Formula to Calculate Debt to Asset Ratio
Total Debt: Includes both long-term debt & long-term provisions.
From the balance sheet of Unreal corporation calculate its debt to asset ratio
Liabilities
Amt
Assets
Amt
Share Capital
2,00,000
Tangible Assets
1,00,000
Long-Term Borrowings
60,000
Non-current Investments
1,10,000
Trade Payable
40,000
Current Assets
90,000
Total
3,00,000
Total
3,00,000
Total Debt – Long-Term Borrowings
Total Asset – Tangible Assets + Non-Current Investments + Current Assets
Total Debt/Total Assets = 60,000/3,00,000 = 0.20
A debt to asset ratio of 0.20 shows that the company has financed 20% of its total assets with outside funds, this ratio shows the extent of leverage being used by a company.
High & Low Debt to Asset Ratio
A lower percentage shows that the company is less dependent on borrowed money from outside parties, or in other words, has less debt as compared to its total assets, this situation is desirable from the point of view of external parties such as creditors & lenders as there is sufficient safety available to them.
A higher percentage, on the other hand, shows that the company depends a lot on its debt (borrowed funds + money owed to others) which ultimately puts external parties such as creditors & lenders to high risk. Debt to asset ratio for a business should be balanced & controlled in a way where it’s not too low but it should also not be too high.
Short Quiz for Self-Evaluation
Loading
Your quiz has been submitted
Want to re-attempt? - “Refresh” this page.
Check out more content on our site :)
Subscribed? - Check your mailbox
Thank You!
Server Side Error
We faced problems while connecting to the server or receiving data from the server. Please wait for a few seconds and try again.
If the problem persists, then check your internet connectivity. If all other sites open fine, then please contact the administrator of this website with the following information.
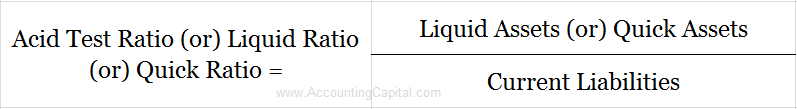
Acid Test Ratio/Liquid Ratio/Quick Ratio is a measure of a company’s immediate short-term liquidity. It is calculated by dividing liquid assets by current liabilities. Liquid assets can be termed as those assets which can almost immediately be converted to cash or an equivalent.
Unlike the current ratio, this doesn’t take into account inventories and prepaid expenses since both of them can’t be seen as liquid assets. Since the quick ratio is a better indicator of liquidity or in other words short-term solvency of a business it becomes a crucial ratio to be examined by Banks and NBFCs to check a firm’s short-term debt paying capacity.
Formula to Calculate Acid Test Ratio/Quick Ratio/Liquid Ratio
Liquid or Quick Assets = (Total Current Assets – Inventory – Prepaid Expenses)
Acid Test Ratio = (Total Current Assets – Inventory – Prepaid Expenses)/Current Liabilities
Example of Acid Test Ratio
Unreal corporation has submitted the below information regarding their current assets and current liabilities, calculate the Acid Test Ratio
Current Assets
Amt
Current Liabilities
Amt
Cash & Equivalents
20,000
Outstanding Expenses
15,000
Marketable Securities
150,000
Provision for Expenses
10,000
Inventories
40,000
Creditors
20,000
Debtors
20,000
Bills Payable
15,000
Prepaid Expenses
10,000
Total
2,40,000
Total
60,000
Calculation:
(Liquid Assets or Quick Assets)/Current Liabilities
(Total Current Assets – Inventory – Prepaid Expenses)/Current Liabilities
(2,40,000 – 40,000 – 10,000)/60,000
1,90,000/60,000
3.16
In the above example the business has 3.16 units of liquid assets for every 1 unit of their short-term liabilities. Looking from the perspective of short-term solvency the company in this case is in a favorable condition.
Usually 1:1 is an acceptable number for acid test ratio since it shows that the business has 1 unit of quick asset for every 1 unit of short-term obligation. A lower ratio than 1:1 indicates financial difficulty for the business.
Short Quiz for Self-Evaluation
Loading
Your quiz has been submitted
Want to re-attempt? - “Refresh” this page.
Check out more content on our site :)
Subscribed? - Check your mailbox
Thank You!
Server Side Error
We faced problems while connecting to the server or receiving data from the server. Please wait for a few seconds and try again.
If the problem persists, then check your internet connectivity. If all other sites open fine, then please contact the administrator of this website with the following information.
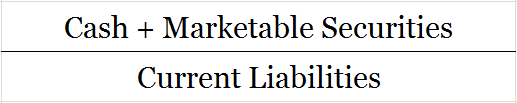
This ratio goes one step ahead of current ratio, liquid ratio & is calculated by dividing super quick assets by the current liabilities of a business. It is called super quick or cash ratio because unlike other liquidity ratios it only takes into account “super quick assets”. This is the most stringent test of a business’ current liquidity situation.
Super quick assets strictly include cash & marketable securities (since they can almost instantly be converted to cash)
Current liabilities would include overdraft, creditors, short-term loans, outstanding expenses, etc.
Formula to Calculate Super Quick or Cash ratio
Example of Super Quick or Cash Ratio
Unreal corp. has submitted the below information regarding their current assets and current liabilities, calculate their super quick ratio.
Higher the super quick ratio better the liquidity condition of a business. In the above case for every 1 unit of current liability, the company has 2.833 units of super quick assets, which is good.
Short Quiz for Self-Evaluation
Loading
Your quiz has been submitted
Want to re-attempt? - “Refresh” this page.
Check out more content on our site :)
Subscribed? - Check your mailbox
Thank You!
Server Side Error
We faced problems while connecting to the server or receiving data from the server. Please wait for a few seconds and try again.
If the problem persists, then check your internet connectivity. If all other sites open fine, then please contact the administrator of this website with the following information.
Ratio analysis is a process of carefully studying the relationships between different data sets inside a company’s financial statements with the help of arithmetic ratios.
It helps in a meaningful understanding of a firm’s performance and its financial position. All major financial statements can act as an input to the ratio analysis, ratios of one set of data or a combination are examined with respect to similar data or combination.
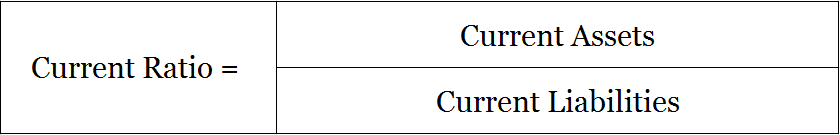
For example – Current Ratio, It can be computed as Current Assets/Current Liabilities
Current Assets – Can be derived from the assets side of a company’s balance sheet
Current Liabilities – Can be sought from the liability side of a company’s balance sheet
Current Assets/Current Liabilities will show the relationship between a company’s current assets and current liabilities. This ratio will help us find out the value of current assets the company holds for every unit of current liability. Accounting ratios are used to do a trend, cross-sectional & various other analysis to ascertain how the company is doing.
Types of Ratios
Liquidity Ratios – These ratios help demonstrate a company’s ability to repay its short-term financial obligations. Higher the liquidity ratio easier it is for the company to cover its short-term debts. E.g. Current Ratio, Liquid/Quick Ratio etc.
Solvency Ratios – These ratios show the long-term financial position of a business, it helps to measure a company’s ability to meet its long-term debt and similar obligations. E.g. Interest Coverage Ratio, Debt to Equity Ratio, Proprietary Ratio etc.
Profitability Ratios – As the name suggests these ratios help to determine the profitability of a firm. E.g. Gross Profit Ratio, Operating Ratio, Return on Investment, Net Profit Ratio etc.
Activity or Turnover Ratios – These ratios show how efficiently a company is using its resources & to identify if there is under or overutilization of resources. E.g. Debtor’s Turnover Ratio, Working Capital Turnover Ratio, Inventory Turnover Ratio etc.
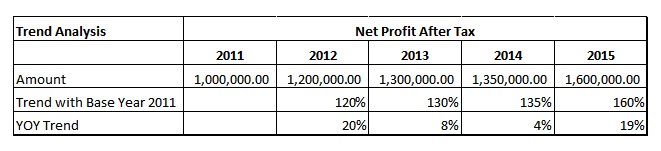
Trend Analysis – In this type of analysis ratios of business are compared with its past records to find out tendencies of growth, stagnation or decline.
Data for anyone period such as a year, month etc. are used as base and data for remaining periods is then worked around it to calculate percentage change subsequently.
In the above example 2 different types of trending can be seen, one with the base year 2011 & year on year trending comparing change from previous years. With base year 2011 Net profit after tax in 2012, 2013, 2014 & 2015 is 120%, 130%, 135% & 160% respectively.
With YOY trending in 2012 NPAT grew 20% with that of 2011, In 2013 in grew 8% with that of 2012 & so on. To explain we used simple numbers, similar trending can be done with ratios & shall be termed as ratio analysis.
Cross-Sectional Study – This is done by analyzing a company’s financial data with that of Industry average or Industry peers i.e. companies of similar size etc.
A comparison is done between competitors or among the industry in which the company operates for e.g. an FMCG company will be compared with the average of entire FMCG sector’s average or with that of another similarly sized competitor.
Short Quiz for Self-Evaluation
Loading
Your quiz has been submitted
Want to re-attempt? - “Refresh” this page.
Check out more content on our site :)
Subscribed? - Check your mailbox
Thank You!
Server Side Error
We faced problems while connecting to the server or receiving data from the server. Please wait for a few seconds and try again.
If the problem persists, then check your internet connectivity. If all other sites open fine, then please contact the administrator of this website with the following information.
Accounting ratios are mathematical expressions demonstrating a relationship between two independent or related accounting figures. Such ratios are calculated on the basis of accounting information. It is usually expressed as A:B, A to B, A/B, etc.
With the help of accounting ratios, a comparative study becomes possible, for example, if you have to prepare a 300-page book and you have a time limit of 100 days to do it, you can now analyze and evaluate (300/100 = 3/1 or 3:1) that you for every 3 pages you have 1 day.
Ratios can be expressed in any of the below formats;
Four Ways to Show Accounting Ratios
Percentage – This type of display is shown in the form of a percentage.
Lets say, Cash flow from operations = 3,00,000 & Current liabilities = 2,00,000
Operating cash flow ratio = 3,00,000/2,00,000 = 3/2, this is the ratio in fraction form and it means for every 3 units of current assets the company has 2 units of current liabilities to be paid.
Times or Turnover Rate– Accounting ratios are also depicted in the form of ‘number of times” or “turnover rate” in comparison to another item.
Lets say, Total Debt = 3,00,000 & Total Assets = 1,00,000
Debt to Asset Ratio = 3,00,000/1,00,000 = 3 Times
It shows the relationship between Total debt and Total assets which in this case is 3 times. So, Total debt of the company is 3 times its total assets.
Short Quiz for Self-Evaluation
Loading
Your quiz has been submitted
Want to re-attempt? - “Refresh” this page.
Check out more content on our site :)
Subscribed? - Check your mailbox
Thank You!
Server Side Error
We faced problems while connecting to the server or receiving data from the server. Please wait for a few seconds and try again.
If the problem persists, then check your internet connectivity. If all other sites open fine, then please contact the administrator of this website with the following information.
The current ratio is a type of liquidity ratio which is established by dividing total current assets of a company with its total current liabilities. It shows the amount of current assets available with a company for every unit of current liability payable
This ratio helps to determine the short-term financial liquidity of a company which indicates how easily the company can meet its short-term financial obligations. It also aids to find out the relationship between current assets and current liabilities of a business.
Formula to Calculate Current Ratio
Current Assets: It includes Cash & its equivalents, B/R, Inventory, Marketable Securities, Debtors, Loans and Advances, Prepaid Expenses, etc.
Current Liabilities: It includes Creditors, B/P, Outstanding Expenses, Provisions, Short-Term Loans etc.
Example of Current Ratio
From the balance sheet of Unreal corporation calculate their current ratio
It shows that for every 1 unit of current liability payable the company has 1.67 units of current assets. An ideal no. for this ratio lies around 1.5 to 2.0 depending upon the kind of business.
Higher the current ratio better the short-term strength of a company, but a deeper analysis of this ratio may also suggest problems such as poor working capital management, stock pile-up, inadequate credit management etc. anything above 2:1 could be considered as high.
On the other hand, a lower current ratio may indicate inadequate working capital & show that the company isn’t sound enough to meet its short-term financial obligations comfortably. A business with low levels may be seen as depending a lot on current liabilities. Anything below 1:1 may be considered as low.
Short Quiz for Self-Evaluation
Loading
Your quiz has been submitted
Want to re-attempt? - “Refresh” this page.
Check out more content on our site :)
Subscribed? - Check your mailbox
Thank You!
Server Side Error
We faced problems while connecting to the server or receiving data from the server. Please wait for a few seconds and try again.
If the problem persists, then check your internet connectivity. If all other sites open fine, then please contact the administrator of this website with the following information.
A purchase order (PO) is an official document generated by a buyer of goods or services as an offer for the seller. It becomes a legal document of the contract once the seller accepts the purchase order.
It describes the types of products/services, quantities, and prices that a buyer agrees to pay for the goods.
When a business wants to order goods it goes through a procurement process where it has to finalize a particular seller out of all available options and consequently has to begin a formal procedure to purchase the goods, generating a PO is among the first few steps of procurement of goods or services.
There are 4 different types of purchase orders such as Standard PO, Planned PO, Blanket PO andContract PO.
Nowadays companies manage their entire procurement process with ERP systems e.g. SAP Ariba, Oracle iProcurement, IBM Emptoris Procurement etc.
It contains the following:
Date of order
PO number
Name and address of the purchaser
Name and address of the supplier
Mode of transport
Details of purchase
Shipping terms
Payment terms
Shipping date
Quantity ordered
Amount
Details of tax (if any)
Signature of the authorized personnel from Seller’s side
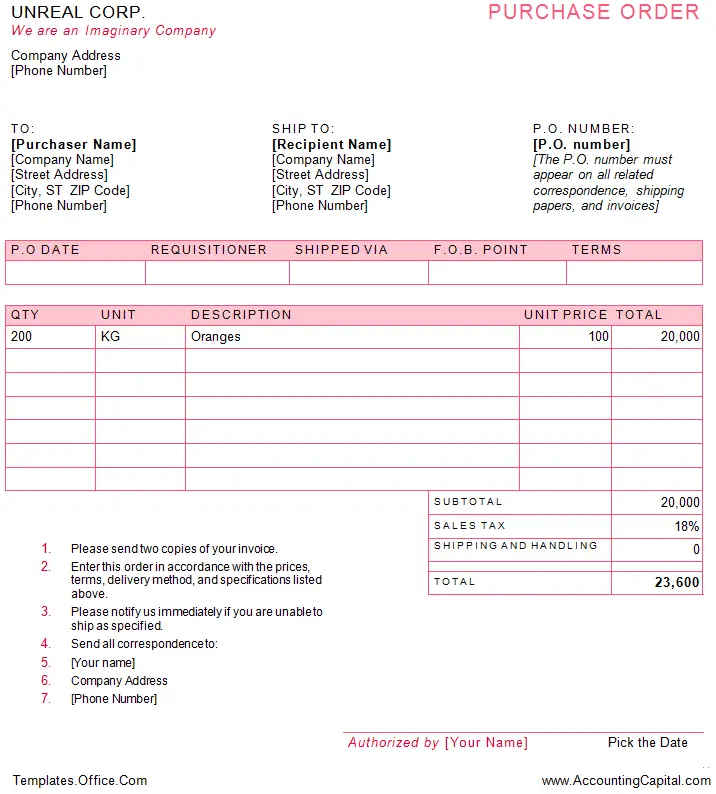
Purchase Order Example Template
Below is a modified snapshot from the linked template showing UNREAL Corp. buying 200kg Oranges at the currency value of 100/kg, the total order value including taxes is 23,600.
Though a PO can look like an invoice they are different and have their own specific purpose.
Types of Purchase Orders
Standard PO – Standard purchase orders (POs) are created when the details of the goods or services required are known. It is used for one-time procurements with complete specifications such as price, quantity, payment terms, and timelines.
Example – A business raises a standard purchase order when it decides to buy 100 new laptops and 50 new workstations with pre-decided payment terms and timelines.
Planned PO – Planned purchase orders state that items or services will be purchased from a single source over the long term.
A PPO (planned purchase order) does not contain delivery information, however, it should include a tentative delivery schedule and all details about the goods or services needed to purchase, including a charge account, quantities, and estimated costs.
Example – A car repair shop may need 100 car screws from a supplier every month to fix the cars of their customers. For this, the repair shop can raise a planned purchase order for 1 year confirming the purchase of 100 screws per month.
Blanket PO – With a blanket purchase order an organization and a supplier enter into a long-term contract to supply products or services at a fixed price at a set frequency. To take advantage of predetermined pricing, suppliers often allow multiple delivery dates over a period of time.
Example – If a company buys a large number of pens and printing paper from the same company throughout the year they usually create a blanket purchase order with a consensus on the unit price for each item and a limit on how many units or how much currency amount can be spent on each line item in a year.
Contract PO – In a contract purchase order, the vendor’s details are outlined, along with possible payment and delivery terms. No specific products are listed for purchase.
As the basis for an ongoing commercial relationship between a purchaser and a vendor, a contract purchase order establishes terms of supply. When raising a standard purchase order, the purchaser can refer to the contract purchase order.
Example – It is created in a business by the procurement manager and a trusted vendor to ensure a smooth ordering process in future. The main reason to create is to avoid any delays in the approval process, especially in the need or urgent deliveries.
Do not miss our 1-minute revision video. This will help you quickly revise and memorize the topic forever. Try it :)
Short Quiz for Self-Evaluation
Loading
Your quiz has been submitted
Want to re-attempt? - “Refresh” this page.
Check out more content on our site :)
Subscribed? - Check your mailbox
Thank You!
Server Side Error
We faced problems while connecting to the server or receiving data from the server. Please wait for a few seconds and try again.
If the problem persists, then check your internet connectivity. If all other sites open fine, then please contact the administrator of this website with the following information.